It’s Getting Darker
The goal of this experiment is to investigate how the intensity of light changes with the distance from a light source such as a bulb or a flashlight.
Equipment Needed:
- CBL Unit,
- TI graphing calculator with a unit-to-unit link cable,
- TI Light sensor,
- A cup of hot water,
- Bulbs (30, 45, and 60 watts),
- Meter stick.
Procedure
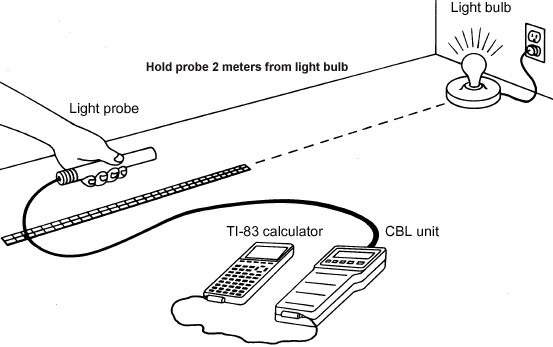
Set up the lamp at the end of a 2 meters flat surface. Starting directly under the bulb (point zero) measure off 20 sections of .10 meters each. Note that while taking intensity readings during the activity, the light sensor should be pointed directly at the illuminated bulb with the end of the sensor held a certain distance from the bulb. Make sure that nothing obstructs the path between the light source and the light sensor when readings are being taken. Individuals should avoid standing near the light bulb since this may cause the light to reflect and result in an erroneous reading. Darken the room with the exception of the light source. See the CBL guidebook for specific setup instructions on how to hook up the light sensor and take readings on light intensity. The readings are in units of mW/cm2.
Investigate
- Create a scatter plot (distance vs. light intensity) for the data using either with your graphing calculator or a spreadsheet.
- Construct a function that will model the data.
- From your best-fit equation (function), what is the relationship between light intensity and distance?
- Using the function predict the light intensity at distances 2.25 meters, 2.5 meters, 3 meters, 4 meters, 5 meters, and 10 meters.
- At what distance do you think that light intensity will be zero (i.e., total darkness)?
Hint: The relationship between light and distance is inverse-squared.