New Nummies
Your company has just paid for research to be conducted on a new product, New Nummies. Research groups were created in order to understand the consumers’ likes and dislikes. Each consumer was asked to rate particular characteristics of New Nummies and Classic Nummies (the Nummies that were sold before New Nummies hit the market). They rated each item on a scale from 1 to 10 (1 being unpleasant/strongly dislike, 10 being pleasant/strongly like). The following table shows the average (mean) of how each age group rated the items.
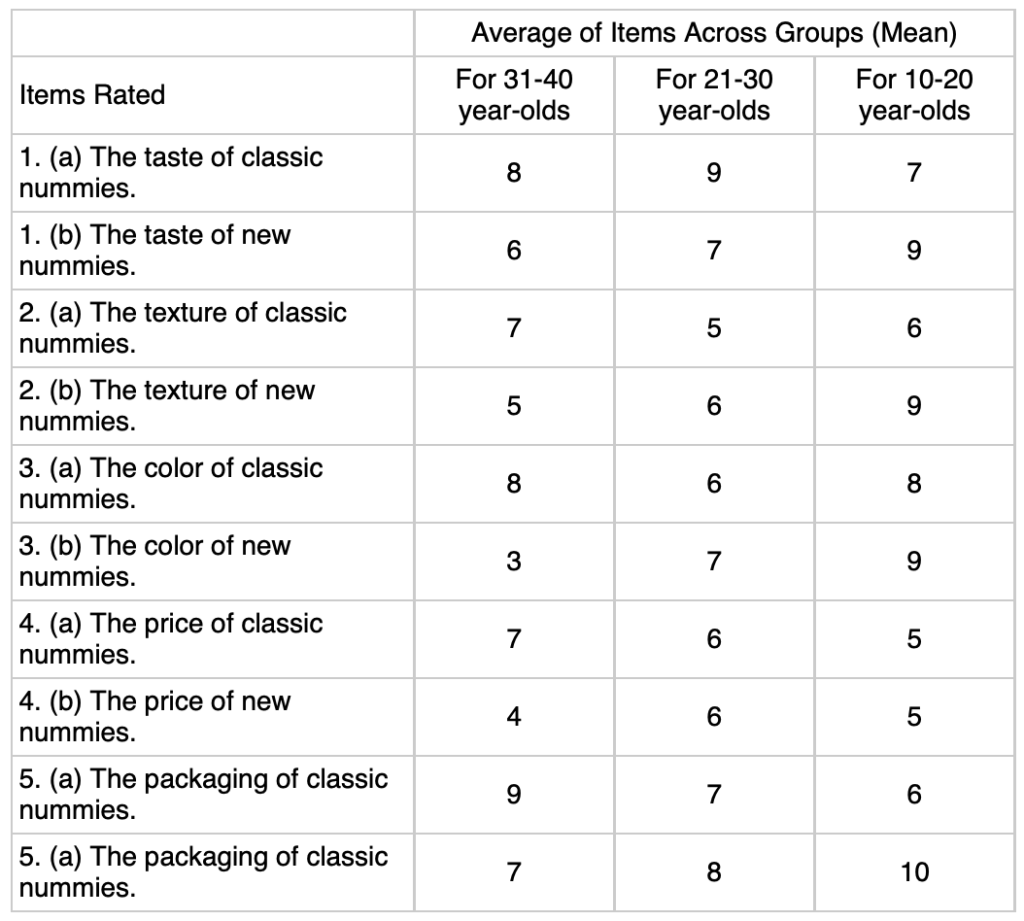
Your boss needs you to analyze the data and present it to the president of your company. Your findings should include a description of the data (i.e. is the data surprising, are there certain data points that are unusual, what does the data tell you and your company?)
The presentation should include a visual representation of the data that is easily understood by everyone at the meeting. Your presentation should include your interpretation of the data. Be prepared to justify your findings to the board.
![]() Extension
Extension
Assume the data do not show what your company was hoping to show. Use the data and explore how you might be able to manipulate it’s presentation so that it fits better with what the company wanted. (This exercise is meant to make you aware of how people can manipulate the presentation of data, not to make you more adept at being dishonest!)