Labeling a Graph

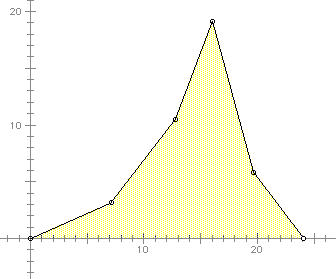
Think of an application in which the labels for the y-axis, the x-axis, and the area (yellow shaded region) on this graph would describe a real world situation. What do each of these values represent in the “real world”? Label the axes using the context you are describing and explain how they relate to the area.
If the highest y-coordinate is 20, what is the greatest possible area?
What does this mean in the context you described?
