Equipment Needed:
- CBL unit,
- TI graphing calculator with a unit-to-unit link cable,
- Vernier CBL motion detector,
- Ring stand and utility clamp,
- Racquetball,
- Hard, level surface (a concrete floor will work fine).
Part I
The height of an up and down bouncing ball with respect to time can be modeled by using quadratic equations. The vertex form of a quadratic equation is
y = a(x – h)2 + k
where y represents the height of the ball and x represents the total elapsed time. In this part, using a motion detector device, you will collect distance and time data for a bouncing ball to find a mathematical model that describes the position of the ball.
Procedure
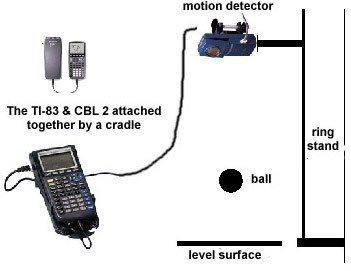
Setup the Calculator Based Laboratory (CBL) system with a motion detector to collect time and distance readings for 4 seconds. See the CBL guidebook for specific setup instructions. Hold the motion detector 5 to 6 feet above the floor and parallel to it. Hold the ball approximately 2 feet below the detector and prepare to release it when the unit begins to click. Activate the system to collect the data. Construct a data table of “Total elapsed time (seconds)” and “height of the ball (meters).”
Investigate
- Create a scatter plot (Total elapsed time (seconds) vs. height of the ball (meters)) for the data using either with your graphing calculator or a spreadsheet,
- Find values for a, h, and k so that the equation fits one of the bounces contained in the data plot. Approximate the vertex (h, k) from your data plot and solve for the value of a algebraically.
- Change the values of a, h, and k in the model found above and observe how the graph of the function is affected on your graphing calculator or computer. Generalize how each of these changes affects the graph. Discuss what change in the values of a, h, and k mean in term of the bouncing ball.
- Expand the equation you found in #2 above so that it is in the standard quadratic form. Select the data from the bounces and enter the data on a spreadsheet and construct a function that will model the data. Using the function, predict the height of the ball after 2 seconds, 3.5 seconds, 6 seconds, or 10 seconds.
Part II
For a bouncing ball up and down on a flat surface, the ratio of the rebound height to the previous height generally remains constant as the ball bounces. In other words, for each bounce, the ratio of the rebound height to the previous height is constant. This percentage is called the rebound rate p. In addition, the rebound height decreases exponentially with each bounce. This can be stated mathematically by
h = Hpn
where H is the initial height and h is the rebound height after n bounces. In this part, using a motion detector device, you will investigate the motion of a bouncing ball in order to develop a mathematical model that describes the ball’s rebound height to the number of times the ball bounces.
Procedure
Setup the Calculator Based Laboratory (CBL) system with a motion detector to collect time and distance readings for 6-7 seconds. See the CBL guidebook for specific setup instructions. Hold the motion detector 5 to 6 feet above the floor and parallel to it. Hold the ball approximately 2 feet below the detector and prepare to release it when the unit begins to click. Activate the system to collect the data. Construct a data table of “Total elapsed time (seconds)” and “height of the ball (meters).”
Investigate
- Create a scatter plot (rebound height vs. bounce) for the data collected.
- Construct a function that will model the data. Using the function, predict the height of the ball after 4th, 6th, 8th, 10th, and 12th bounces.
- Does this equation agree with the mathematical model relating rebound height and bounce number that was described in the introduction section?
- By what average percentage did the ball’s rebound height decrease with each bounce?
- Repeat this experiment at least two more times and record all relevant data in your lab notebook. For one of the trials, vary the ball’s release height. To what extent does the initial height affect the rebound rate? Explain your answer. For another trial, use a different type of ball, such as a tennis ball or a basketball. List several physical characteristics of the balls that you suspect might have an effect on the rebound rate.
Adopted from: