Math in Motion
The following explorations use a motion detector connected to a graphing calculator to explore the meaning of slope. (NOTE: Teachers can borrow calculators and/or Calculator-Based Laboratory Units (CBLs) to preview from Texas Instruments at http://www.ti.com/calc/docs/loan.htm. Texas Instruments will send the items you request, you preview them for a week, and then return the items in the postage-paid package that TI provides.)
1. Which direction must you walk with respect to the motion detector to make each of the following graphs?
a) 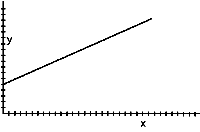
b) 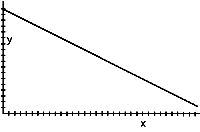
2. In this exercise, you will trace each calculator graph on a transparency. Make sure you label each graph so you can identify each with the description below. Walk at a constant rate away from the motion detector as described below.
A) Create a graph that looks like one of the graphs in problem 1 (above).
B) Create another graph by walking more slowly than you did for part a.
C) Create another graph by walking more quickly than you did for part a.
Explain why the graphs look like they do.
3. Now create graphs by walking toward the motion detector. Remember to walk at a constant rate as described below. Use a second transparency to trace each graph.
A) Create a graph that looks like one of the graphs in problem 1 (above).
B) Create another graph by walking more slowly than you did for part a.
C) Create another graph by walking more quickly than you did for part a.
Explain why the graphs look like they do.
How do these graphs compare to those graphs created in problem 2?
4. If you travel at a constant speed and go a long distance in a short time, how would the graph look? Describe a real-world situation in which you might travel in this way.
5. If you travel at a constant speed and go a short distance in a long time, how would the graph look? Describe a real-world situation in which you might travel in this way.
6. Linear graphs are graphs formed by straight lines. Sketch a linear graph on a transparency. Using the motion detector, walk to create a graph that matches the one you drew. Now draw a graph that is made up of two or three linear pieces similar to those shown below. Using the motion detector, can you walk to create a graph to match your drawing?
a) 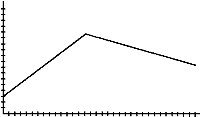
b) 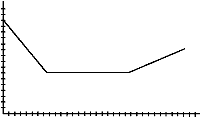
c) 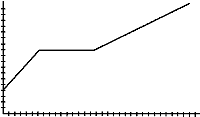
7. Using the motion detector, can you create the graph in the figure below? If so, how? If not, why not?
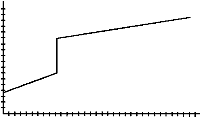
8. Using a motion detector, walk to create one graph from each pair of graphs shown below. You may need to try your walk several times until you get it close to the graphs shown. Trace each graph on a transparency and write a sentence to describe how you walked to create the graph.
a) 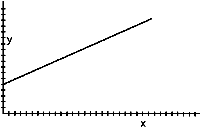 b)
b) 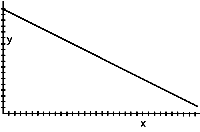
Pair 1
c) 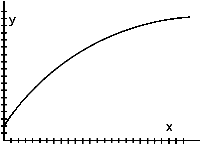 d)
d) 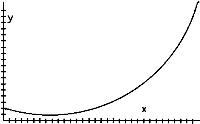
Pair 2
e) 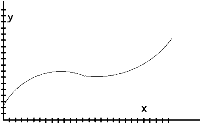 f)
f) 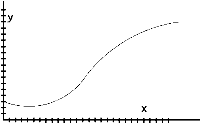
Pair 3
9. If you were to create the second graph of each pair, how must your movement be different from that required to make the first graph?
10. Gavin and Austen walk five blocks to a park along different routes. Suppose that Gavin’s graph is the first graph of the pair shown in Pair B and that Austen’s is the second. Write a sentence describing how each boy walked. Assume that each boy encountered a hill on his walk. At what part of the walk did Gavin walk over the hill? At what part of the walk did Austen walk over the hill? Why do you think so?
11. Use the motion detector to recreate the four graphs below. Write a sentence or two describing how you moved in each example.
a)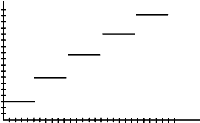 b)
b)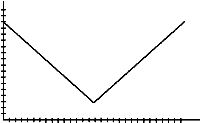
c)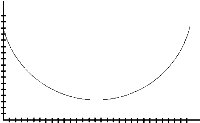 d)
d)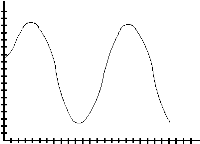
12. We call the horizontal axis the x-axis and the vertical axis the y-axis. Which variable, x or y, represents the time you traveled? Which variable represents your distance from the motion detector? How do you know?
13. In which direction, relative to the motion detector, must you walk if –
A) the y-values on the graph increase as the x-values increase?
B) the y-values on the graph decrease as the x-values increase?
C) the y-values on the graph stay the same as the x-values increase?
14. How fast should you walk if the graph is not very steep? If it is quite steep?
15. Take a walk to create a graph that looks like the one below. If you walk heel to toe, you will find it easier to duplicate the important part(s) of this walk to create the graphs requested in questions 16 and 17. Trace this graph on a transparency so that you can compare it with the graphs you create later.
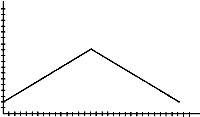
16. How will the graph look if you walk in the same way as in question 15, but begin farther away from the motion detector. Draw your guess. Now take the walk. How does the graph compare with the graph from question 15?
17. How will your graph appear –
A) if you walk the same distance as in question 15 but in half the time? Draw your guess. Take the walk.
B) if you walk the same distance as in question 15 but in twice the time? Draw your guess. Take the walk. Does the entire graph appear on the screen? Why or why not?
18. Walk as you did in question 15, but –
A) start walking 3 seconds before the motion detector starts recording your motion. Guess how the new graph should look, and explain why.
B) start walking 5 seconds after the motion detector starts recording your motion. How should the new graph look?
19. Eduardo, Kelsey, Gissel, and Rickita enter a 5-meter Baby Day Race. They must crawl from the start line to the finish line. Eduardo crawls at a speed as shown by the graph below, completing the race in 12 seconds. The graphs indicates Eduardo’s progress from the moment the starting bell rang to the end of the race. On the same set of axes, sketch graphs that show the following scenarios. Then write a sentence for each, explaining how you know that your graph is correct.
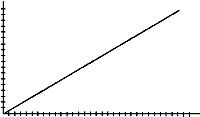
A) Kelsey started the race at a point one-fifth of the way to the finish line and crawled at the same speed as Eduardo, starting when the bell rang.
B) Gissel started the race at the start line when the bell rang but crawled at a rate twice as fast as Eduardo.
C) Rickita started the race at the start line but did not begin crawling until five seconds after the bell rang. She crawled at the same rate as Eduardo.
From your graph, can you tell who won the race? Explain.
What do you notice about the graphs of Kelsey, Eduardo, and Rickita? Why do they appear this way?
(Adapted with permission from “Graphs in Real Time”, Mathematics Teaching in the Middle School, copyright 1999 by the National Council of Teachers of Mathematics. All rights reserved.)
