Chill Out
Equipment Needed:
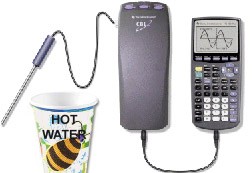
- CBL Unit,
- TI graphing calculator with a unit-to-unit link cable,
- Vernier CBL motion detector,
- TI Temperature Probe,
- A Cup of Hot Water.
Procedure
Get a cup of hot water to be used in this experiment. The water should be very hot, but not boiling. Measure its initial temperature (time = 0) and then record temperature readings each minute for 30 minutes. See the CBL guidebook for specific setup instructions. Make note of the room temperature.
Investigate
- Create a scatter plot (time vs. temperature) for the data using either with your graphing calculator or a spreadsheet.
- Construct a function that will model the data.
- Using the function predict the temperature after 45 minutes, 60 minutes, or 300 minutes.
- Calculate a measure of the error between your model and the observed data by taking the square of the difference for each time, sum the squares, and divide by the number of data points. You can use this statistic to guide refinement of your function to model the data.
Hint:
Newton ‘s law of cooling provides us with a theoretical model for this situation. It states that the temperature difference between a hot object and its surroundings decreases exponentially with time. In other words:
T(x) = a.bx + c
where x is time and T is temperature. In this model, c represents the room temperature; the value the modeling function is approaching as the curve flattens out. Based on the data, determine the values of a, b, and c.